With the kickoff of the 2018 FIFA World Cup in Russia just 50 days away, pundits have already spilled gallons of ink eyeing teams as tournament favorites or dark horses. These teams, elevated by the talking heads, are often lauded for excellent qualification campaigns: it is assumed that the “momentum” of the qualifiers will carry through to the tournament itself. How true is this assertion?1
The World Cup has come a long way from its initial tournament in Uruguay 88 years ago, in which 13 teams participated. That year, every country affiliated with FIFA was invited to compete, and few European teams chose to participate because of the difficulty of traveling to South America. FIFA instituted a simple play-in qualification system in the following World Cup in 1934. The qualification system has morphed drastically since then. In the World Cup qualifiers today, a vast number of nations compete for a much more limited number of spots in the final tournament. Nations have changed associations as Australia did with its move to the Asian Football Confederation, the defending champions no longer receive an automatic berth as of the 2006 tournament, and Austria was even forced to withdraw from its spot once after being invaded by Germany, among other oddities. This cycle, 210 teams competed for the 32 spots in this year’s tournament.
To test if teams who perform better in the qualifiers systematically find greater success in the tournament itself, I collect World Cup qualifying and finals match data since the very first tournament by using web scraping tools. I use a variety of models to predict success in the final tournament for a particular country in a specific year using its matched qualification data. Countries that did not go through qualifying but were still in the final tournament (the host2 of a particular tournament and the defending champion up until 2006) are not included in my analysis. Note that none of these estimated coefficients are indentified, this a purely predictive exercise!
I use four independent, or predictor, variables as a measure of qualification success: qualifying points ratio, qualifying goal differential per game, qualifying goals for per game, and qualifying goals against per game. Two dependent, or outcome, variables measure success in the finals of the tournament: World Cup performance and World Cup finals points ratio.
The “points ratio” variables take advantage of soccer’s use of points (3 for a win, 1 for a draw, and 0 for a loss)3 to measure a team’s performance. It is simply the total number of points achieved by a team, whether in qualifiers or the final tournament, divided by the total number of points possible. A value of 1 in this variable represents perfect performance, (i.e. all wins), while values closer to 0 represent worse performance. An important note for my data for the World Cup finals is that matches that go into penalty shootouts count as draws for the purpose of point calculation.
The World Cup performance variable I use is a simple dummy variable that takes a value of 1 if a team won the World Cup and a value of 0 if a team did not win the World Cup.
The goals variables are straightforward: they measure the number of goals scored by a team (and the number of goals scored against that same team) divided by the number of games that team played. The goal difference variable is simply the sum of the difference between goals for and against each game divided by the total number of games played.
Each of the models I use to predict the binary outcome4 (winning the World Cup outright) are not statistically significant at the p<0.05 level. This holds for when the data I use represents all World Cup tournaments (except, of course the 1930 World Cup that did not have a qualification tournament) as well as the “modern” World Cup tournaments (I define these as the 1998 World Cup onward, as in each of these finals there were 32 teams, the number of teams currently in place). Though teams that do perform better in the qualifiers have an increased likelihood of winning the World Cup, there is not enough evidence to suggest that this relationship is anything more than an artifact of random chance.
The linear models I use attempt to predict the World Cup finals points ratio. These models do find some of the qualifying variables to be statistically significant when applied to all of the World Cup tournaments. However, this relationship disappears when the model is applied only to the tournaments starting in 1998. Why is this the case? Take a look at the graph below for an illustrative example of a statistically significant result when using all World Cup tournaments, using qualifying goals for per game:
Figure 1. Qualifying goals for per game versus World Cup finals points ratio, all tournaments
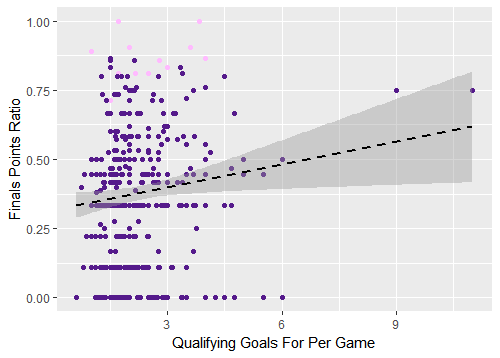
The pink dots represent teams that won the World Cup. The x-axis represents the average number of goals scored by a team in qualifying while the y-axis represents how well a team performed in a World Cup. A single dot represents the intersection point of these two variables. In other words, a team that had a qualifying goals per game value of 9 and a World Cup Finals Points Ratio of 0.75 and would appear at that respective point on the graph: (9, 0.75). Scoring 9 qualifying goals per game is extremely impressive — how did this team (Germany in 1934) not win the World Cup? There’s a problem: this data point came from a single match – it is not a good representative sample of qualifying performance. The following graph has its points weighted so that the dots are larger based on the number of games played in qualifying:
Figure 2. Qualifying goals for per game versus World Cup finals points ratio, all tournaments, point size determined by number of qualifying matches played
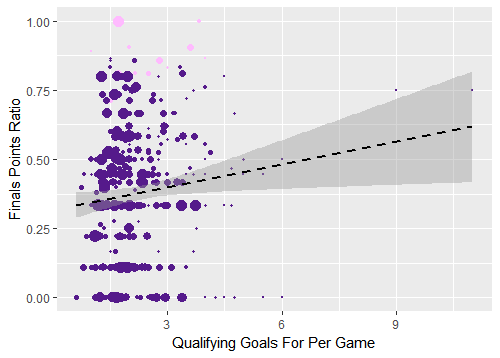
In the regression models, these outliers are valued the same as all of the larger dots on the left, which is likely affecting the results. To account for this, we can consider only the tournaments since 1998, which as discussed earlier represent all of the 32-team tournaments. The average number of qualification games played by a team in the tournaments before 1998 was 5.77 compared to 12.33 in the tournaments from 1998 onward.5 This gives us a larger sample of qualification performance (though it is still a pretty small sample overall).
None of the independent variables were statistically significant in the linear models when predicting performance in instances of the World Cup since 1998. Paying particular attention to the x-axis, check out what the same graph we’ve been digging into looks like for only “modern” tournaments:
Figure 3. Qualifying goals for per game versus World Cup finals points ratio, tournaments since 1998
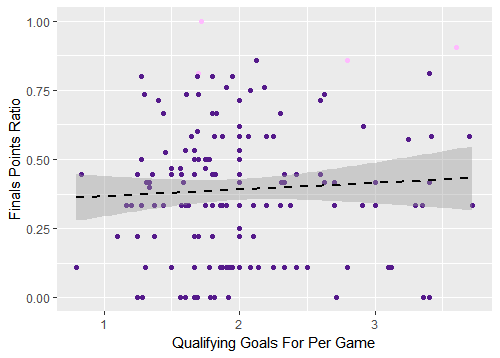
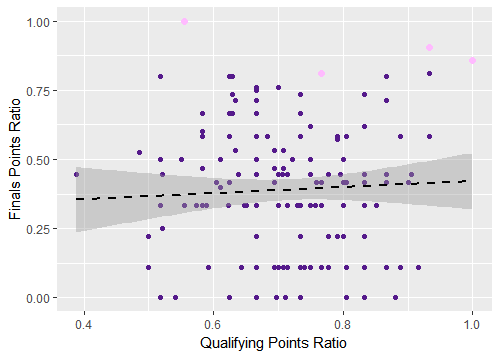
It’s a much different picture: the relationship is no longer statistically significant. I’ve used qualifying goals for per game as an example for the purposes of this piece, but this pattern generally holds for the rest of the predictor variables as well. The final two graphs illustrate the lack of a pattern for the qualifying points ratio variable and you can create your own graphs by using the code in my GitHub repository as a starting point.
Ultimately, there is not enough evidence to suggest that teams that perform better in the qualifiers6 will necessarily be more likely to win the World Cup for reasons other than those due to chance. Because for an individual team the World Cup is only a handful of matches, there are a lot of opportunities for “worse” teams to get lucky and advance in the knockout stages. If the World Cup were many dozens of matches longer, in all likelihood we would see a much stronger relationship between success in the qualifiers and success in the final tournament (though the qualifiers themselves also have sample size issues, as discussed earlier).
How did your favorite team do this qualification cycle? You can calculate the qualifying points ratio for your team by looking at their 2018 qualification results and find their place on the x-axis in the following two graphs. Where does it look like your team might fall on the y-axis based on the regression line and how previous teams with similar qualification results performed? It’s tough to tell, right?
Better performance in the qualifiers can help (and of course, a team must at least be decent in the qualifiers to even make it to the World Cup), but just scraping by qualifiers to barely make it to the tournament (like Brazil did in 2002) is not a death sentence, and romping through qualification is no guarantee of the ultimate success, especially in the modern era.
Figure 4. Using qualifying points ratio to predict World Cup finals points ratio, all tournaments
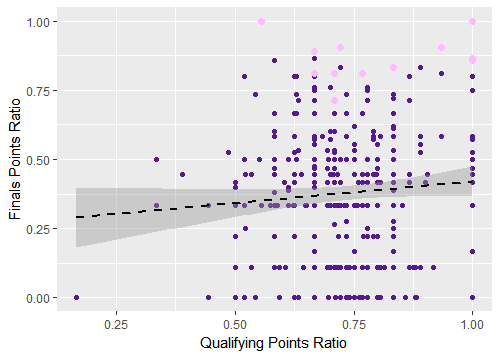
Figure 5. Using qualifying points ratio to predict World Cup finals points ratio, tournaments since 1998
1 All of my code, including the web scraping and cleaning I used for data collection, as well as the data itself can be found on my GitHub profile in this repository. Using the readme, you can run your own models and create your own graphs if you are familiar with R and ggplot.
2 Readers familiar with the World Cup will know that hosts generally perform pretty well in World Cup finals, with hosts winning 6 of the 20 tournaments: Uruguay 1930, Italy 1934, England 1966, Germany 1974, Argentina 1978, and France 1998. Though home-field advantage almost certainly plays an important role here, the notion that hosts require “competitive” qualifiers as opposed to friendlies to prepare for the tournament is shakier due to this pattern.
3 In the past, 2 points were awarded for wins, but after a dreadfully boring 1990 World Cup, FIFA changed the point values to how they stand today. If you are interested, my replication data contains “points ratio” variables that represent how FIFA used to count wins before this change.
4 I use logistic models and complementary log-log models. The complementary log-log models are frequently used when the probability of the binary outcome is very small (as is the case winning a World Cup, about 4.7%) or very large.
5 Fewer trials, in this case, matches, are subject to a higher possibility of random error. The more matches a team plays, the closer (in theory) we approach a team’s “true” performance or statistics per game. That said, even for the tournaments from 1998 onward, an average of 12 matches isn’t a particularly large sample size: another indicator that qualification performance can be a noisy measure. If you’d like, you can set your own subset for the models and figures, creating a cutoff of say, not including teams with less than 4 qualification matches played regardless of the World Cup year. It is likely, that using such a cutoff (and even the 1998 cutoff) could make it so that the the removed observations are not missing at random, which could skew results.
6 An important caveat here is that qualifying points are not “made equally,” so to speak. Qualifying from certain confederations is easier than others. You can use my GitHub page to run analyses at the confederation level, but you will find that most of the predictor variables are not statistically significant at the p<0.05 level (for some of the not statistically significant models, the predictors even show a negative correlation) with these exceptions: linear model CONCACAF qualifying goals against for “modern” tournaments, linear models OFC goals against for all tournaments and for “modern” tournaments, all of the linear models for UEFA for all tournaments, all logistic models UEFA qualifying points ratio for “modern tournaments”, linear model UEFA qualifying points ratio for “modern” tournaments. Nonetheless, the R-square values of these models are extremely low, indicating that qualifying performance explains a small percentage of the variation in World Cup finals performance.
Appendix, Regression Tables
Table A1. Logistic models, champion dummy as outcome, all tournaments
| Dependent variable: | ||||
| Champion dummy | ||||
| (1) | (2) | (3) | (4) | |
| qpp | 3.181 | |||
| (2.162) | ||||
| qgdpg | 0.220 | |||
| (0.194) | ||||
| qgfpg | 0.152 | |||
| (0.211) | ||||
| qgapg | -0.947 | |||
| (0.872) | ||||
| Constant | -5.830*** | -3.754*** | -3.748*** | -2.741*** |
| (1.743) | (0.461) | (0.599) | (0.619) | |
| Observations | 368 | 368 | 368 | 368 |
| Log Likelihood | -51.788 | -52.354 | -52.661 | -52.176 |
| Akaike Inf. Crit. | 107.577 | 108.707 | 109.323 | 108.352 |
| Note: | *p<0.1; **p<0.05; ***p<0.01 | |||
Table A2. Logistic models, champion dummy as outcome, “modern” tournaments
| Dependent variable: | ||||
| Champion dummy | ||||
| (1) | (2) | (3) | (4) | |
| qpp | 8.298* | |||
| (4.932) | ||||
| qgdpg | 0.654 | |||
| (0.663) | ||||
| qgfpg | 1.051 | |||
| (0.697) | ||||
| qgapg | 1.419 | |||
| (1.651) | ||||
| Constant | -9.971** | -4.573*** | -5.927*** | -4.677*** |
| (4.027) | (1.194) | (1.770) | (1.426) | |
| Observations | 153 | 153 | 153 | 153 |
| Log Likelihood | -16.977 | -18.059 | -17.475 | -18.166 |
| Akaike Inf. Crit. | 37.955 | 40.118 | 38.950 | 40.332 |
| Note: | *p<0.1; **p<0.05; ***p<0.01 | |||
Table A3. Complementary log-log models, champion dummy as outcome, all tournaments
| Dependent variable: | ||||
| Champion dummy | ||||
| (1) | (2) | (3) | (4) | |
| qpp | 3.133 | |||
| (2.113) | ||||
| qgdpg | 0.208 | |||
| (0.185) | ||||
| qgfpg | 0.145 | |||
| (0.205) | ||||
| qgapg | -0.930 | |||
| (0.858) | ||||
| Constant | -5.812*** | -3.752*** | -3.750*** | -2.770*** |
| (1.709) | (0.447) | (0.584) | (0.606) | |
| Observations | 368 | 368 | 368 | 368 |
| Log Likelihood | -51.785 | -52.365 | -52.665 | -52.178 |
| Akaike Inf. Crit. | 107.569 | 108.730 | 109.330 | 108.355 |
| Note: | *p<0.1; **p<0.05; ***p<0.01 | |||
Table A4. Complementary log-log models, champion dummy as outcome, “modern” tournaments
| Dependent variable: | ||||
| Champion Dummy | ||||
| (1) | (2) | (3) | (4) | |
| qpp | 8.426* | |||
| (4.738) | ||||
| qgdpg | 0.643 | |||
| (0.648) | ||||
| qgfpg | 1.034 | |||
| (0.674) | ||||
| qgapg | 1.381 | |||
| (1.619) | ||||
| Constant | -10.089*** | -4.572*** | -5.906*** | -4.662*** |
| (3.904) | (1.177) | (1.731) | (1.403) | |
| Observations | 153 | 153 | 153 | 153 |
| Log Likelihood | -16.927 | -18.058 | -17.470 | -18.170 |
| Akaike Inf. Crit. | 37.855 | 40.117 | 38.940 | 40.340 |
| Note: | *p<0.1; **p<0.05; ***p<0.01 | |||
Table A5. Linear models, final points ratio as outcome, all tournaments
| Dependent variable: | ||||
| Finals Points Ratio | ||||
| (1) | (2) | (3) | (4) | |
| qpp | 0.156* | |||
| (0.093) | ||||
| qgdpg | 0.035*** | |||
| (0.011) | ||||
| qgfpg | 0.027** | |||
| (0.012) | ||||
| qgapg | -0.052* | |||
| (0.027) | ||||
| Constant | 0.264*** | 0.326*** | 0.317*** | 0.419*** |
| (0.070) | (0.021) | (0.029) | (0.024) | |
| Observations | 368 | 368 | 368 | 368 |
| R2 | 0.008 | 0.026 | 0.015 | 0.010 |
| Adjusted R2 | 0.005 | 0.023 | 0.012 | 0.007 |
| Residual Std. Error (df = 366) | 0.243 | 0.241 | 0.242 | 0.243 |
| F Statistic (df = 1; 366) | 2.841* | 9.781*** | 5.546** | 3.726* |
| Note: | *p<0.1; **p<0.05; ***p<0.01 | |||
Table A6. Linear models, final points ratio as outcome, “modern” tournaments
| Dependent variable: | ||||
| Final Points Ratio | ||||
| (1) | (2) | (3) | (4) | |
| qpp | 0.109 | |||
| (0.170) | ||||
| qgdpg | 0.010 | |||
| (0.027) | ||||
| qgfpg | 0.024 | |||
| (0.032) | ||||
| qgapg | 0.044 | |||
| (0.066) | ||||
| Constant | 0.312** | 0.377*** | 0.343*** | 0.360*** |
| (0.123) | (0.040) | (0.066) | (0.049) | |
| Observations | 153 | 153 | 153 | 153 |
| R2 | 0.003 | 0.001 | 0.004 | 0.003 |
| Adjusted R2 | -0.004 | -0.006 | -0.003 | -0.004 |
| Residual Std. Error (df = 151) | 0.236 | 0.237 | 0.236 | 0.236 |
| F Statistic (df = 1; 151) | 0.409 | 0.133 | 0.561 | 0.449 |
| Note: | *p<0.1; **p<0.05; ***p<0.01 | |||
comments powered by Disqus