With the craze of this past summer’s tournament died down (and because I’m a bit behind on my second World Cup modeling project using youth championship data to predict senior level results), I decided to turn my attention to my as-of-yet incomplete 2018 Panini World Cup album. For those who have no idea what I am talking about, the Italian company Panini Group has been publishing a fun, collectible sticker album of the players on World Cup rosters since 1970. The album starts empty at the time of purchase, with several hundred missing slots for stickers of players (and stadiums, team crests, etc.) for you to fill in by buying packs of stickers. After buying a few packs, you inevitably run into “repeats,” stickers you have already pasted into your album, and these can be traded with others to help make the completion much easier, a nice little lesson in gains from trade for the young ones. I started collecting at the tender age of 11 with the 2006 FIFA World Cup, memories of marathon trading sessions in the cafes of my hometown in Miami vividly in my mind. Since then, I (alongside the help of my parents) have put in a ton of work every World Cup year to complete every album.
In 2018, however, I had fallen behind and had around 100 missing stickers, far after anyone near me might still want to reasonably trade. I began to wonder how many packs I would have to buy to get to 50 missing stickers now that I could no longer trade. The 50 stickers remaining mark is the point where Panini will let you directly order your missing stickers individually instead of buying packs and hoping for the best. This sparked my curiosity of how many stickers one would have to buy if trading was not possible at all, so I decided to model the expected number of stickers necessary to complete the album. Thanks to Jon Corin and Ricky Martinez for helping me think this fun little problem through.
To view how to approach this problem more simply, let’s think about dice, or a die, to be precise. Each face of the die will symbolize a sticker in our meagre 6-sticker example album. How many rolls would it take me to roll each face of the die at least once? Well, with our first roll, we are guaranteed to get a new die face (6/6), so let’s say we roll a 2. In the next roll, we are looking for any number that is not a 2, which means we have a 5/6 chance to get a new number. By the time we have rolled all but one of my die faces, we “only” have a 1/6 chance of rolling that last missing die face. The album works just like this problem, but with a 681-sided die. That might be a little tough to roll…
The expected number of stickers required to complete the 2018 FIFA World Cup album—which has 681 slots—can be expressed by the following summation:
\[\sum_{i=1}^{681} 681/i\]This is basically telling us to sum up 681/1, 681/2, 681/3, 681/4… and so on until reaching 681/681. Each value represents the expected number of stickers one would have to buy, on average, to fill in each slot in the album. The first value, 681/1 (or just 681) represents the very last sticker one is missing. If you have 680 stickers and need to get that last sticker, you only have a 1/681 probability of your next sticker not being a duplicate (that is, the final missing sticker) so you would on average, have to buy 681 stickers to find your needle in the haystack. Of course, it could take you much longer, or you could get very lucky, but this is just an average value. Each element of the sum (the number of stickers you would have to buy to fill in that “slot”) gradually gets smaller and smaller before eventually reaching 1, which represents the very first sticker. If the album is completely empty, the first sticker will definitely not be a repeat.
When you add up all of these fractions, you reach the expected number of stickers one needs to buy to complete the album: 4,837 (the exact answer is 4836.129675916725). If you buy a 20-pack of stickers for $20 you would have to buy and open ~242 packs at a cost of $4,840! An important assumption here is that each sticker has an equally likely chance of appearing in a pack.
The graph below represents this formula, but the order is reversed from the summation for ease of understanding (that is, the first value on the x-axis represents the first sticker, which only requires 1 purchased sticker to ensure that the sticker is not a repeat). You can see that the last few stickers require a lot of “drawings” (sticker purchases) to successfully fill in the album.
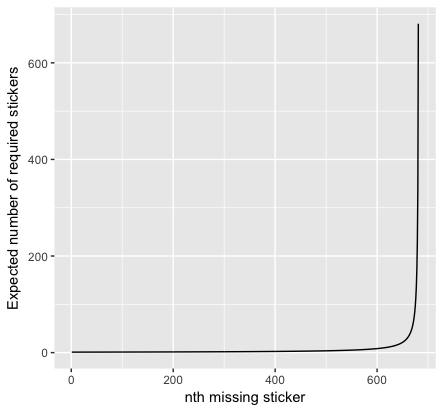
If you just want to get to 631 stickers, the point at which you can order your missing stickers directly and individually from Panini, we can simply remove the first 50 elements of the summation formula (the last 50 values in the above graph). This gives us an expected value of 1,773 stickers (1772.170841). You would have to buy approximately 89 packs. Price? $1,780—still pretty hefty.
To explore this problem further, I decided to write the following script in R (with the help of Faris Natour) that would simulate 10,000 attempts at completing the World Cup sticker album without trading:
album = list()

for (i in seq(1,10000)) {
  a <- list()

  n <- 0
  while (length(a) < 681) {
    randomNumber <- sample(1:681,1)
    if (is.element(randomNumber,a) == 0) {
      a[[length(a)+1]] <- randomNumber
      n <- n + 1
    }
    else {
      n <- n + 1
    }
  }
  album[[length(album) + 1]] <- n
  print(i)
}
Reduce('+',album)/length(album)
This block of code basically creates an empty list named album and then randomly generates a number from 1 to 681. It then checks if the randomly generated number is currently in album. If this is false, it inserts this number into the list. If this is true, it generates a new number. This process repeats until the list reaches the length of 681 unique numbers, and logs how many iterations it took to complete the album. Next, the whole process repeats 10,000 times to create a distribution of 10,000 simulations of the amount of stickers it would take to complete the album. Here is what this distribution looks like:
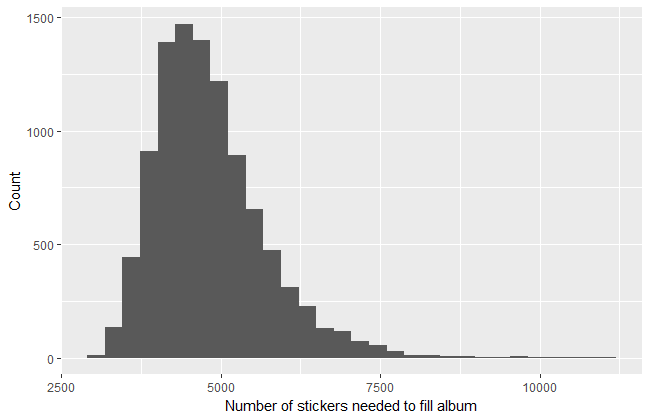
As you can see, the highest frequency of observations cluster around our expected number of stickers required to fill the album, just under 5,000. The mean of the 10,000 simulations was 4,824.246. You’ll also notice that the distribution is right-skewed, that is, that the right tail is longer and the mean is larger than the median (which is around 4,600). This is because there is a hard minimum number of stickers that it could take to complete the album (681) assuming you never draw a repeated sticker but also a theoretically boundless maxmimum. If a simulation kept drawing repeats over and over again its result could be a very large number far above the expected value. Such outliers affect the mean, but not the median, which explains why the former is larger than the latter. The luckiest “participant” completed his album with just 2,987 stickers bought. On the other end of the spectrum, some poor “sucker” got stuck needing to buy $11,020 worth of stickers! Thankfully, most sticker-collecting enthusiasts do not have go through so much pain: trading stickers makes the process much simpler and easier.
comments powered by Disqus