This weekend’s Riddler Express asks solvers to model a peculiar game of tic-tac-toe where all nine pieces (five Xs and four Os) are placed into the nine slots on the board randomly.
Edit: Fun! This solution was mentioned in the article describing the answer. You can read the write-up here.
Here’s the full puzzle:
A local cafe has board games on a shelf, designed to keep kids (and some adults) entertained while they wait on their food. One of the games is a tic-tac-toe board, which comes with nine pieces that you and your opponent can place: five Xs and four Os.
When I took my two-year-old with me, he wasn’t particularly interested in the game itself, but rather in the placement of the pieces.
If he randomly places all nine pieces in the nine slots on the tic-tac-toe board (with one piece in each slot), what’s the probability that X wins? That is, what’s the probability that there will be at least one occurrence of three Xs in a row at the same time there are no occurrences of three Os in a row?
The answer, interestingly, is around 49%. This might seem counterintuitive given that there are more X pieces than O pieces, but the key is that we are searching for the probability that there will be at least one occurrence of three Xs in a row AND no occurrences of three Os. There are actually quite a few situations in this perverse version of tic-tac-toe where you’ll have both Xs and Os have three pieces in a row. You can see a few different scenarios at the end of this post.
Anyways, I wanted to share the way I approached this. I started with function in R to model the game.
First, we create a vector of each of our pieces.
pieces <- c(rep("X", 5), rep("O", 4))
Then, I’m creating a function, tictactoe_winner, which we’ll eventually end up running many times. Before we get to that, I’ll go through each of the steps necessary to create the function. This initializes the function (it takes no arguments) and creates a matrix filled with a random selection–without replacement—of each of the 9 pieces in the pieces vector. Next we need to figure out how the game turned out.
tictactoe_winner <- function() {
  tictactoe <- matrix(sample(pieces, 9), nrow = 3, ncol = 3)
Starting from the middle of this next line, apply applies a function over the rows or columns of a matrix. In this case, 1 means that the function will be applied over the rows of the matrix of interest, tictactoe. The function that is being applied is a dummy function. Essentially we’re checking to see whether each row is exactly equal to a vector c("X", "X", "X")), or three Xs in a row by checking if the sum of the logical vector produced by testing some random row of Xs and Os.
For example, if the row generated is X-X-O, then x == c("X", "X", "X") for that particular row will be TRUE, TRUE, FALSE. When the sum of that vector (values of TRUE are equal to one) is three, then it means one of the rows contains three Xs in a row.
This is done over the three possible rows of the matrix, which returns another logical vector of length three that is representing each of the rows, where TRUE means there were three Xs in a row for that row. We can use sum to add up the TRUE values of that logical vector to get the number of times that there were three consecutive Xs in each row (of course, since there are only 5 total Xs, it’s impossible for there to be more than one row with three consecutive Xs, but we’ll return to that later).
x_row_win <- sum(apply(tictactoe, 1, function(x) sum(x == c("X", "X", "X")) == 3))
This line does the exact same thing as the previous line, but it is applied over columns (hence the 2) instead of rows.
x_col_win <- sum(apply(tictactoe, 2, function(x) sum(x == c("X", "X", "X")) == 3))
These two lines capture each of the possible ways that there can be consecutive Xs along diagonals by testing to see whether the relevant cells in the matrix all contain Xs. In other words, tictactoe[1,1] == "X" & tictactoe[2,2] == "X" & tictactoe[3,3] == "X" returns a logical vector of length three, with values of TRUE for each of the Xs in those respective cells. When the sum of this vector is three, then there were three consecutive Xs on this diagonal.
x_diag1_win <- sum(tictactoe[1,1] == "X" & tictactoe[2,2] == "X" & tictactoe[3,3] == "X")
x_diag2_win <- sum(tictactoe[3,1] == "X" & tictactoe[2,2] == "X" & tictactoe[1,3] == "X")
The two cases are as follows. In the first case, the Xs are aligned along what’s known in linear algebra as the main diagonal:
\[\begin{bmatrix} \textbf{X} & \text{O} & \text{O} \\ \text{O} & \textbf{X} & \text{X} \\ \text{X} & \text{O} & \textbf{X} \end{bmatrix}\]In the second case, there are consecutive Xs in the antidiagonal:
\[\begin{bmatrix} \text{O} & \text{O} & \textbf{X} \\ \text{O} & \textbf{X} & \text{X} \\ \textbf{X} & \text{O} & \text{X} \end{bmatrix}\]Notice how in this case (it’s just an example), the Xs player won in two ways. The problem does not specify that the pieces should be placed in a particular order, nor that the game should be stopped once a single player wins, so I’m considering these cases as valid.
Now that we have each of the eight different ways that there could be three consecutive Xs, we only need to check whether at least one of these occurred (recall from the discussion above that there could be two, though no more than two, given the restriction of the number of pieces).
x_wins <- sum(x_row_win, x_col_win, x_diag1_win, x_diag2_win) >= 1
Originally, this was the extent of the function I had written, but then I realized I forgot to consider what happens with the Os. Replicating the exact same steps as above, but with the Os, we have the following lines:
o_row_win <- sum(apply(tictactoe, 1, function(o) sum(o == c("O", "O", "O")) == 3))
o_col_win <- sum(apply(tictactoe, 2, function(o) sum(o == c("O", "O", "O")) == 3))
o_diag1_win <- sum(tictactoe[1,1] == "O" & tictactoe[2,2] == "O" & tictactoe[3,3] == "O")
o_diag2_win <- sum(tictactoe[3,1] == "O" & tictactoe[2,2] == "O" & tictactoe[1,3] == "O")
However, here we want to make sure there are no occurrences of three Os in a row, so we can rewrite the last line as follows. Note that there is no possibility for O to win in two separate ways because there are only four O pieces.
o_loses <- sum(o_row_win, o_col_win, o_diag1_win, o_diag2_win) < 1
Our objects of interest are thus x_wins and o_loses, which are single logical values. We need them both to be true at the same time so we can say:
result <- x_wins & o_loses
  return(result)
}
And have the function return the result. We’re done!
We can run the function many times over like so to estimate the percentage of the time the conditions specified hold, getting to our answer of 49%.
sims <- 10^6
set.seed(3720)
sum(sapply(1:sims, function(s) tictactoe_winner()))/sims
There’s more fun to be had, though! Let’s dig in a little bit deeper. As written, the function does not let us assess how each of the draws occurred. We can use a much messier version of this code to test that exactly.
This time, we’re using lapply to create a list of the randomly generated matrices for each simulation:
pieces <- c(rep("X", 5), rep("O", 4))

set.seed(3720)
sims <- 10^6
tictactoe <- lapply(1:sims, function(s) matrix(sample(pieces, 9), nrow = 3, ncol = 3))
And now, we can use sapply to generate vectors that will return the results of each of the aforementioned lines of the function for each simulation. The [[s]] index captures each simulated matrix of tic-tac-toe results in the tictactoe list.
x_row_win <- sapply(1:sims, function(s) sum(apply(tictactoe[[s]], 1, function(x) sum(x == c("X", "X", "X")) == 3)))
x_col_win <- sapply(1:sims, function(s) sum(apply(tictactoe[[s]], 2, function(x) sum(x == c("X", "X", "X")) == 3)))
x_diag1_win <- sapply(1:sims, function(s) sum(tictactoe[[s]][1,1] == "X" & tictactoe[[s]][2,2] == "X" & tictactoe[[s]][3,3] == "X"))
x_diag2_win <- sapply(1:sims, function(s) sum(tictactoe[[s]][3,1] == "X" & tictactoe[[s]][2,2] == "X" & tictactoe[[s]][1,3] == "X"))
x_wins <- sapply(1:sims, function(s) sum(x_row_win[s], x_col_win[s], x_diag1_win[s], x_diag2_win[s]) >= 1)

o_row_win <- sapply(1:sims, function(s) sum(apply(tictactoe[[s]], 1, function(o) sum(o == c("O", "O", "O")) == 3)))
o_col_win <- sapply(1:sims, function(s) sum(apply(tictactoe[[s]], 2, function(o) sum(o == c("O", "O", "O")) == 3)))
o_diag1_win <- sapply(1:sims, function(s) sum(tictactoe[[s]][1,1] == "O" & tictactoe[[s]][2,2] == "O" & tictactoe[[s]][3,3] == "O"))
o_diag2_win <- sapply(1:sims, function(s) sum(tictactoe[[s]][3,1] == "O" & tictactoe[[s]][2,2] == "O" & tictactoe[[s]][1,3] == "O"))

o_loses <- sapply(1:sims, function(s) sum(o_row_win[s], o_col_win[s], o_diag1_win[s], o_diag2_win[s]) < 1)

result <- x_wins & o_loses
sum(result)/sims
This lets us compare the simulation to some analytic solutions. For example, what’s the probability of X winning on one of the diagonals?
summary(x_diag1_win)
This returns a mean of 0.119, very close to the exact value of $\frac{5}{42}$ which we get by multiplying the likelihood of an X in the first (5 Xs out of 9 pieces), second (4 Xs out of 8 pieces), and third (3 Xs out of 7 pieces) cells, accounting for the changing size of the bag:
\[\frac{5}{9} \times \frac{4}{8} \times \frac{3}{7} = \frac{5}{42}\]Multiplying this value times three would give you the exact value of the rows and columns, $\frac{5}{14}$, which is very close to the value of 0.357 from running summary(x_row_win).
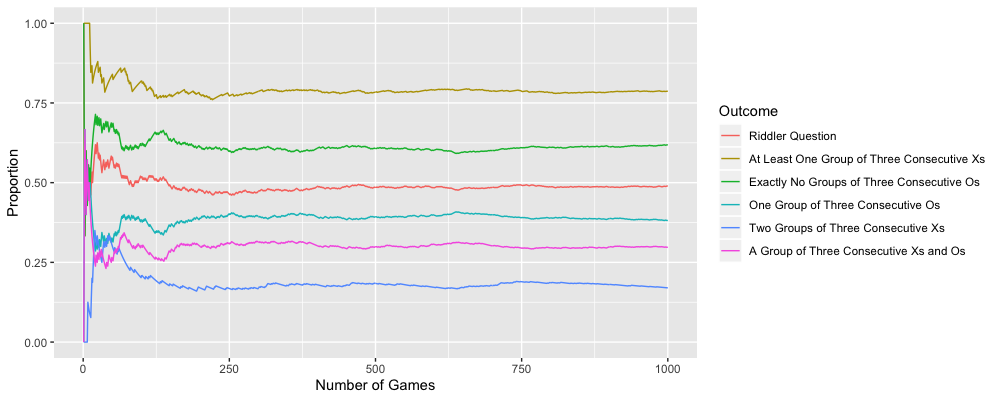
The analytic answers for some of the other quantities of interest are a bit more complicated, so I won’t run through them here, but you can use this code to play around with the resuts. As a bonus, I made a graph that shows the pretty quick convergence of a few different results:
Thanks for reading! I’ve included the full set of code at the end of this post.
pieces <- c(rep("X", 5), rep("O", 4))

tictactoe_winner <- function() {
  tictactoe <- matrix(sample(pieces, 9), nrow = 3, ncol = 3)
  x_row_win <- sum(apply(tictactoe, 1, function(x) sum(x == c("X", "X", "X")) == 3))
  x_col_win <- sum(apply(tictactoe, 2, function(x) sum(x == c("X", "X", "X")) == 3))
  x_diag1_win <- sum(tictactoe[1,1] == "X" & tictactoe[2,2] == "X" & tictactoe[3,3] == "X")
  x_diag2_win <- sum(tictactoe[3,1] == "X" & tictactoe[2,2] == "X" & tictactoe[1,3] == "X")
  x_wins <- sum(x_row_win, x_col_win, x_diag1_win, x_diag2_win) >= 1

  o_row_win <- sum(apply(tictactoe, 1, function(o) sum(o == c("O", "O", "O")) == 3))
  o_col_win <- sum(apply(tictactoe, 2, function(o) sum(o == c("O", "O", "O")) == 3))
  o_diag1_win <- sum(tictactoe[1,1] == "O" & tictactoe[2,2] == "O" & tictactoe[3,3] == "O")
  o_diag2_win <- sum(tictactoe[3,1] == "O" & tictactoe[2,2] == "O" & tictactoe[1,3] == "O")
  o_loses <- sum(o_row_win, o_col_win, o_diag1_win, o_diag2_win) < 1

  result <- x_wins & o_loses
  return(result)
}

sims <- 10^6
set.seed(3720)
sum(sapply(1:sims, function(s) tictactoe_winner()))/sims

set.seed(3720)
sims <- 10^6
tictactoe <- lapply(1:sims, function(s) matrix(sample(pieces, 9), nrow = 3, ncol = 3))

x_row_win <- sapply(1:sims, function(s) sum(apply(tictactoe[[s]], 1, function(x) sum(x == c("X", "X", "X")) == 3)))
x_col_win <- sapply(1:sims, function(s) sum(apply(tictactoe[[s]], 2, function(x) sum(x == c("X", "X", "X")) == 3)))
x_diag1_win <- sapply(1:sims, function(s) sum(tictactoe[[s]][1,1] == "X" & tictactoe[[s]][2,2] == "X" & tictactoe[[s]][3,3] == "X"))
x_diag2_win <- sapply(1:sims, function(s) sum(tictactoe[[s]][3,1] == "X" & tictactoe[[s]][2,2] == "X" & tictactoe[[s]][1,3] == "X"))
x_wins <- sapply(1:sims, function(s) sum(x_row_win[s], x_col_win[s], x_diag1_win[s], x_diag2_win[s]) >= 1)

o_row_win <- sapply(1:sims, function(s) sum(apply(tictactoe[[s]], 1, function(o) sum(o == c("O", "O", "O")) == 3)))
o_col_win <- sapply(1:sims, function(s) sum(apply(tictactoe[[s]], 2, function(o) sum(o == c("O", "O", "O")) == 3)))
o_diag1_win <- sapply(1:sims, function(s) sum(tictactoe[[s]][1,1] == "O" & tictactoe[[s]][2,2] == "O" & tictactoe[[s]][3,3] == "O"))
o_diag2_win <- sapply(1:sims, function(s) sum(tictactoe[[s]][3,1] == "O" & tictactoe[[s]][2,2] == "O" & tictactoe[[s]][1,3] == "O"))

o_loses <- sapply(1:sims, function(s) sum(o_row_win[s], o_col_win[s], o_diag1_win[s], o_diag2_win[s]) < 1)

result <- x_wins & o_loses
sum(result)/sims

results <- as.data.frame(as.numeric(result[1:1000]))
names(results) <- "X_raw"
results$Simulation <- 1:nrow(results)

library(data.table)
results <- data.table(results)
results[, AggregateX := cumsum(X_raw)]

results$`Riddler Question` <- results$AggregateX/results$Simulation

results$X_only_raw <- as.numeric(sapply(1:1000, function(s) sum(x_row_win[s], x_col_win[s], x_diag1_win[s], x_diag2_win[s]) >= 1))
results[, AggregateX_only_raw := cumsum(X_only_raw)]
results$`At Least One Group of Three Consecutive Xs` <- results$AggregateX_only_raw/results$Simulation

results$O_loses_raw <- as.numeric(sapply(1:1000, function(s) sum(o_row_win[s], o_col_win[s], o_diag1_win[s], o_diag2_win[s]) < 1))
results[, AggregateO_loses_raw := cumsum(O_loses_raw)]
results$`Exactly No Groups of Three Consecutive Os` <- results$AggregateO_loses_raw/results$Simulation

results$O_wins_raw <- as.numeric(sapply(1:1000, function(s) sum(o_row_win[s], o_col_win[s], o_diag1_win[s], o_diag2_win[s]) >= 1))
results[, AggregateO_wins_raw := cumsum(O_wins_raw)]
results$`One Group of Three Consecutive Os` <- results$AggregateO_wins_raw/results$Simulation

results$X_twice_raw <- as.numeric(sapply(1:1000, function(s) sum(x_row_win[s], x_col_win[s], x_diag1_win[s], x_diag2_win[s]) == 2))
results[, AggregateX_twice_raw := cumsum(X_twice_raw)]
results$`Two Groups of Three Consecutive Xs` <- results$AggregateX_twice_raw/results$Simulation

o_wins <- sapply(1:sims, function(s) sum(o_row_win[s], o_col_win[s], o_diag1_win[s], o_diag2_win[s]) >= 1)

both_win_raw <- x_wins & o_wins

results$both_win_raw <- as.numeric(both_win_raw[1:1000])
results[, Aggregateboth_win_raw := cumsum(both_win_raw)]
results$`A Group of Three Consecutive Xs and Os` <- results$Aggregateboth_win_raw/results$Simulation

results <- results[,c(2, 4, 7, 10, 13, 16, 19)]
results <- melt.data.table(results, id.vars = "Simulation")
names(results) <- c("Simulation", "Outcome", "value")

library(ggplot2)

ggplot(data = results, aes(x = Simulation, y = value, group = Outcome)) +
  geom_line(aes(color = Outcome)) +
  scale_y_continuous(name = "Proportion", limits = c(0,1)) +
  scale_x_continuous(name = "Number of Games", limits = c(0,1000))