This week’s Riddler Classic features the classic set-up for probability problems: an urn containing different colored balls. Here’s the text of the puzzle, and my solution below.
This week’s Classic may seem nonsensical at first. But surely there’s more to it…
You have an urn with an equal number of red balls and white balls, but you have no information about what that number might be. You draw 19 balls at random, without replacement, and you get eight red balls and 11 white balls. What is your best guess for the original number of balls (red and white) in the urn?
The answer is 34, and while there’s a very straightforward way to get to this answer using the hypergeometric distribution, I’d like to share my full approach to the problem, warts and all! But first I will start with the simplest solution.
The hypergeometric distribution works perfectly here. It describes a scenario where a sample of size $k$ is randomly selected without replacement from a population of $N$ items. In our case, $k = 19$, and $N$ is the parameter that will vary.
Next, we need to characterize $m$ and $n$, which are the different colored balls in the urn. Without loss of generality, let’s call $m$ the number of red balls and $n$ the number of white balls. Note that $N - m = n$ and $N - n = m$. For this problem, there are an equal number of red and white balls, so we can simplify things and say $m = n = \frac{N}{2}$. The last parameter we need to worry about we’ll call $x$, which is the number of balls of a particular color we seek. In this problem, $x = 8$.
More generally, we can write:
\[{m \choose x} \times {n \choose k-x} \Bigg/ {N \choose k}\]To focus on our actual problem, let’s start by noting that the values of $N$ we must check must be even, because there must be an equal number of red and white balls. We can also note that the minimum $N$ we must check is 22, because if $N = 20$, then the minimum number of red balls drawn is 9, so we can’t have 8 red balls drawn at all.
\[{11 \choose 8} \times {11 \choose (19-8)} \Bigg/ {22 \choose 19} = \frac{165}{1,540} = \frac{3}{28}\]Now it’s just a matter of figuring out which $N$ maximizes this outcome. Fortunately, we can do this very easily in R with the built-in dhyper function, we just need to iterate over different values of $N$. I’m loading in the tidyverse just for the purposes of general data wrangling.
library("tidyverse")

N <- seq(from = 22, to = 50, by = 2) # set different values of N to test

results <- sapply(1:length(N), function(i)

  dhyper(
    x = 8, # number of red balls we seek in sample (draw)
    m = N[i]/2, # total number of red balls in population (urn)
    n = N[i]/2, # total number of white balls in population (urn)
    k = 19) # number of draws (sample size)

)

results <- tibble(N = N,
                  likelihood = results)
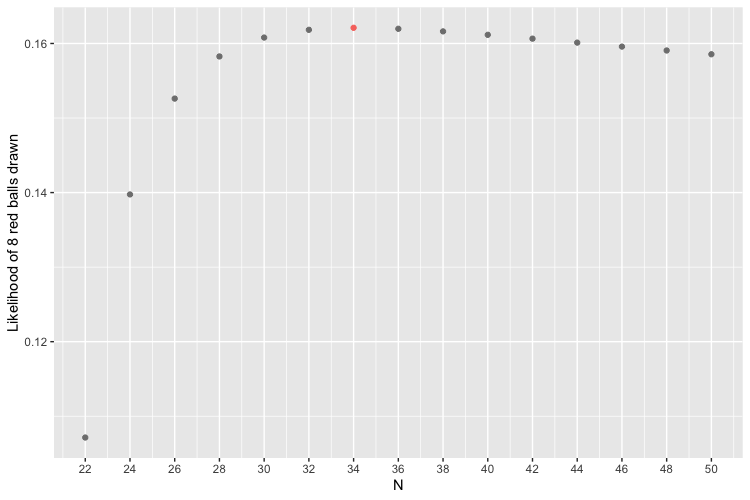
Here, we can see that the winner is 34. The likelihood that eight red balls drawn in this scenario increases for $N = 22, 24, 26, 28, 30, 32$ until it peaks at $N = 34$ and then slowly decreases. Intuitively, it makes sense that it would decrease after reaching its maximum, since it becomes less and less likely to draw exactly eight red balls as the total number of balls increases.
| N | Likelihood of drawing 8 red balls |
|---|---|
| 22 | 0.1071429 |
| 24 | 0.1397516 |
| 26 | 0.1526087 |
| 28 | 0.1582609 |
| 30 | 0.1607946 |
| 32 | 0.1618320 |
| 34 | 0.1621044 |
| 36 | 0.1619721 |
| 38 | 0.1616239 |
| 40 | 0.1611634 |
| 42 | 0.1606494 |
| ... | ... |
We can also create a figure to see the function better.
results <- results |> mutate(max = ifelse(prob == max(prob), "winner", NA))

ggplot(results, aes(x = N, y = prob, color = max)) +
  geom_point() +
  scale_y_continuous(name = "Likelihood of 8 red balls drawn") +
  scale_x_continuous(breaks = N) +
  theme(legend.position = "none")
So now let’s turn to my failed first tries. Before coming to the realization with the hypergeometric distribution, I thought about simulating the answer.
I started with a very inefficient attempt that began with a function to simulate 19 draws from the urn, and counting the number of red balls, varying $N$:
set.seed(06172022)

simulate_draw <- function(N) {

  urn <- sample(c(rep("red", N/2), rep("white", N/2)))

  draw <- sample(urn, size = 19, replace = FALSE)

  red_count <- as.numeric(sum(draw == "red"))

  return(red_count)

}
Iterating over different values of $N$ and simulating many times works fine, but it’s quite slow.
N <- seq(from = 22, to = 50, by = 2)
sims <- 10^4

results <- lapply(1:length(N), function(x)
              tibble(red_count =
                sapply(1:sims, function(y)
                  simulate_draw(N[x])
                )
              ) |>
                mutate(N = N[x])
            )
Worse still, it’s very imprecise! When summarizing the results, I saw quite a weird shape that didn’t sit right with me, and even got a different answer over different attempts.
results <- bind_rows(results)

results <- results |>
  group_by(red_count, N) |>
  summarize(likelihood = n()/sims) |>
  filter(red_count == 8) |>
  mutate(max = ifelse(likelihood == max(likelihood), "winner", NA))
If you look at the final table with the exact answers, you’ll notice a lot of the probabilities for different values of $N$ are quite close to each other. And so I thought to just crank up the number of simulations. But I got lazy waiting for this code to run, and so I sought out ways to make it more efficient.
Doing permutations in the tidyverse would be a lot more efficient, but I couldn’t figure out a way to get the whole urn object into a column without it being unwiedly. That’s when it hit me that I was bringing it a lot of unnecessary information! I don’t need to know the exact composition of the urn, just the total number of red balls. This led me to simulating with random draws of the hypergeomtric distribution (didn’t get the lightbulb above my head quite yet):
sims <- 10^6

results <- tibble(N = seq(from = 22, to = 50, by = 2)) |>
  crossing(sim = 1:sims) |>
  group_by(N) |>
  mutate(balls = N/2) |>
  group_by(N, sim) |>
  mutate(red_count = rhyper(nn = 1, # number of observations
                       m = balls, # number of red balls
                       n = balls, # number of white balls
                       k = 19)) |> # number of draws
  group_by(red_count, N) |>
  summarize(likelihood = n()/sims) |>
  filter(red_count == 8) |>
  mutate(max = ifelse(likelihood == max(likelihood), "winner", NA))
And while waiting for that to run, even though it was orders of magnitude faster than my first attempt, it hit me to simply use dhyper instead of rhyper. Hooray for precision!