The 2022 FIFA World Cup is in full swing! (Vamos Argentina!) Accordingly, friend of the blog Ricky Martinez posed a fun question to me:
If team A beats team B in the group stage, how often does team A place higher than team B at the end of the group stage?
This is a cool question because it has both an empirical answer—we can look back to previous World Cups and see how often this is the case historically—and a theoretical one—there are only so many possible permutations of FIFA World Cup groups, and fixing the status of one match narrows it down quite a bit. Here we’ll take the latter approach, although I may come back to this and seek out the empirical answer too.
If all this means gibberish to you, come along with me for some quick explanation for how the FIFA World Cup works. All of the FIFA competitor nations, divided by “confederations” (that roughly correspond to continents) host qualifying tournaments to determine the final 32 teams (as of now) that make it to the World Cup. Those 32 teams are divided into 8 groups of 4 teams each to start the tournament off. This group stage is played round robin style, with each team within each group playing the other members of its group once. The top two teams of each group move forward to the knockout stage of the World Cup, at which point 16 teams face off in a single-elimination tournament for the chance to be crowned world champion.
The question is straightforward, given that a particular team wins against another team, how often does that team score more highly in the group stage? Theoretically, assuming every result is equally likely (not a reasonable assumption since some teams are better than others), we can simply calculate all the possible permutations of the group stage to arrive at our answer. I will show how to do so in R below. We’ll start by creating a vector of the number of teams in each group (four as of now, but this has varied in the past), and creating a simple table that defines each match (when teams play each other once, there are 6 matches played in each group).
# create vector of teams

N_teams <- 4
teams <- LETTERS[1:N_teams]

# possible match-ups

matches <- data.frame(combinations(n = N_teams,
                                   r = 2,
                                   v = teams,
                                   repeats.allowed = FALSE)) |>
  rename(team_1 = X1,
         team_2 = X2)
Now we’ll list out all possible results. For each match, a team can either win, draw, or lose in the group stage. This leads to $3^6 = 729$ possible results. We’re ignoring the score of each and only focus on the outcome for simplicity. The possible_results object is a matrix with dimensions $729 \times 6$, so each row represents the results for each match.
# all possible results (729)

possible_results <- permutations(n = 3,
                                 r = 6,
                                 v = c("W", "L", "D"),
                                 repeats.allowed = TRUE)

# create list with match-ups and results

matches <- lapply(1:nrow(possible_results), function(i)
  matches |>
    mutate(team_1_result = possible_results[i,],
           team_2_result = case_when(
             team_1_result == "W" ~ "L",
             team_1_result == "D" ~ "D",
             team_1_result == "L" ~ "W"
           ))
)
Based on all possible results of the matches, we can create the group stage table in the traditional format, which is a table of four rows, one for each team, and each team’s corresponding point total. We parameterize the number of points for a win, as a win is currently worth 3 points, but in the past has been worth 2 points.
# how many points for a win

win_points <- 3

# create all possible tables resulting from matchups

tables <- lapply(matches, function(i)
  i |>
    pivot_longer(c("team_1", "team_2"),
                 values_to = "team") |>
    arrange(team) |>
    mutate(result = case_when(
      name == "team_1" ~ team_1_result,
      name == "team_2" ~ team_2_result
    )) |>
    select(team, result) |>
    mutate(points = case_when(
      result == "W" ~ win_points,
      result == "D" ~ 1,
      result == "L" ~ 0
    )) |> group_by(team) |>
    summarize(points = sum(points)) |>
    arrange(desc(points))
)
We are ready to analyze the outcomes simply by counting. Before turning to the main question, we simply check how many times a particular team has more points than another team generally. We can compare any team to any other without loss of generality.
# how many times does team A have more points than B generally? WLOG

mean(sapply(tables, function(i)
  filter(i, team == "A")$points > filter(i, team == "B")$points
))

mean(sapply(tables, function(i)
  filter(i, team == "A")$points >= filter(i, team == "B")$points
))
The results are $\frac{318}{729}$ and $\frac{411}{729}$, respectively for checking outright more points or greater than or equal to points, since we are not considering tiebreakers.
To answer the question directly, we will condition the tables to only the set of tables where Team A beats Team B, again without loss of generality.
# select only possibilities where team A beats team B,

team_A_beat_B <- which(sapply(matches, function(i)
  filter(i, team_1 == "A" & team_2 == "B")$team_1_result == "W")
)

conditioned_tables <- lapply(team_A_beat_B, function(i)
 tables[[i]]
)
This reduces the number of tables to 243. Finally, we can count again:
# how many times did A have more points than B conditional on A beating B?

mean(sapply(conditioned_tables, function(i)
  filter(i, team == "A")$points > filter(i, team == "B")$points
))

mean(sapply(conditioned_tables, function(i)
  filter(i, team == "A")$points >= filter(i, team == "B")$points
))
These results are $\frac{201}{243}$ and $\frac{225}{243}$, respectively. So you are very likely to pass the team you beat in the group stage in points conditional on beating them, which makes sense, but it’s not certain!
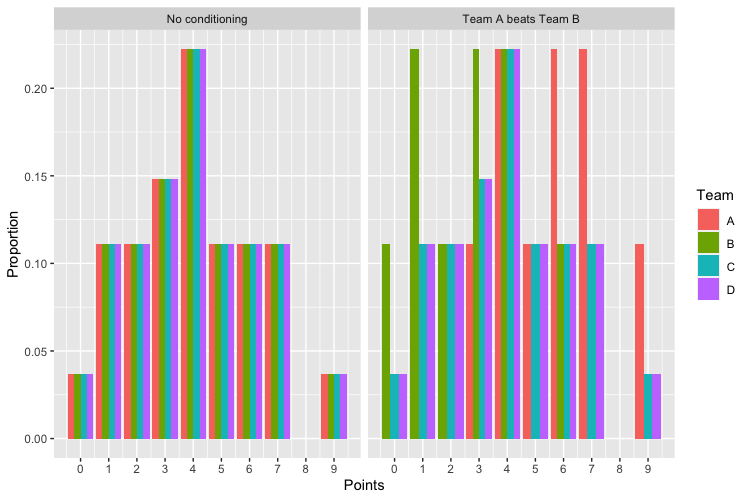
Here’s a figure of the distributions of points in both scenarios to illustrate further differences, with the source code below.
tables_summarized <- bind_rows(tables, .id = "sim") |>
  group_by(team, points) |>
  summarize(prop = n()/length(tables))

conditioned_tables_summarized <- bind_rows(conditioned_tables, .id = "sim") |>
  group_by(team, points) |>
  summarize(prop = n()/length(conditioned_tables))

both_tables_summarized <- bind_rows(tables_summarized, conditioned_tables_summarized, .id = "condition") |>
  mutate(condition = ifelse(condition == 1, "No conditioning", "Team A beats Team B"))

ggplot(both_tables_summarized, aes(x = points, y = prop, fill = team)) +
  geom_col(position = "dodge") +
  scale_x_continuous(name = "Points", breaks = 0:9) +
  scale_y_continuous(name = "Proportion") +
  scale_fill_discrete(name = "Team") +
  facet_wrap(~condition)
Stay tuned (maybe, most likely, I’m pretty deep in the World Cup fever) for the historical answer.
comments powered by Disqus